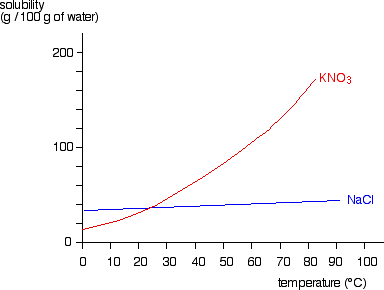
The solubility of solids changes as temperature changes. This can be plotted on a solubility curve.
The salts shown on this graph are typical: the solubility increases as temperature increases.
For example, the graph above shows that in 100g of water at 50⁰C the maximum mass of potassium nitrate (KNO₃) which will dissolve is 80g.
However, if the temperature were 80⁰C a mass of 160g of potassium nitrate (KNO₃) would dissolve in 100g of water.


