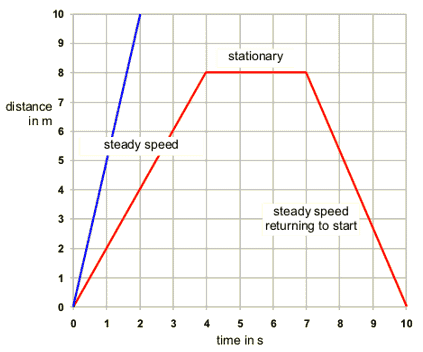
1.03 plot and explain distance-time graphs
A distance time graph has distance on the y axis (usually in metres) and time on the x axis (usually in seconds). The gradient of the line (change in y/ change in x) is the speed. If the line is flat then the object is stationary.


